Disturbance detection

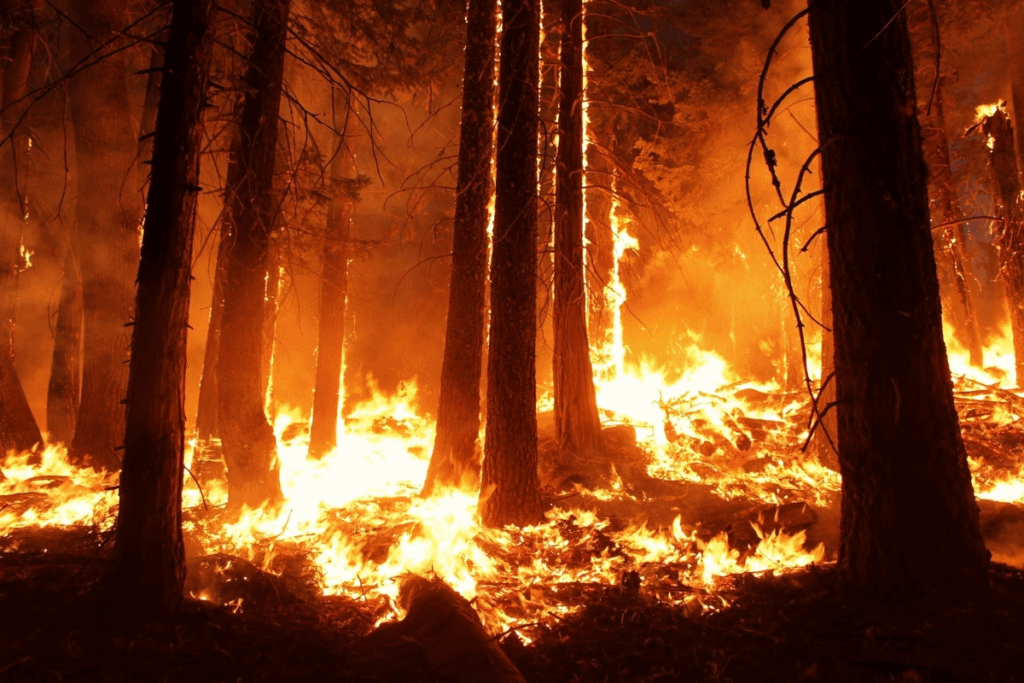
Disturbance detection within non-stationary time series from satellite imagery is a crucial and challenging task that can help policymakers, natural resource managers, and researchers in making proper decisions and actions. Disturbances can be caused by many factors, such as wildfire, drought, flood, and insect attack. For more details please see Near-Real-Time Monitoring and Change Detection
Wildfire

Some of our team members have been working on developing a machine learning technique to quickly detect and classify such disturbances. The technique uses a spectral analysis method which can also identify the type of disturbances, part of which is joint work with scientists in NASA Jet Propulsion Laboratory

High-resolution climate projection

Global climate models are a class of models used for forecasting weather, understanding different climates, and projecting climate change. These mathematically based models show how energy and matter interact in different parts of the ocean, atmosphere, and land. They greatly help us to understand complex systems and our ecosystems

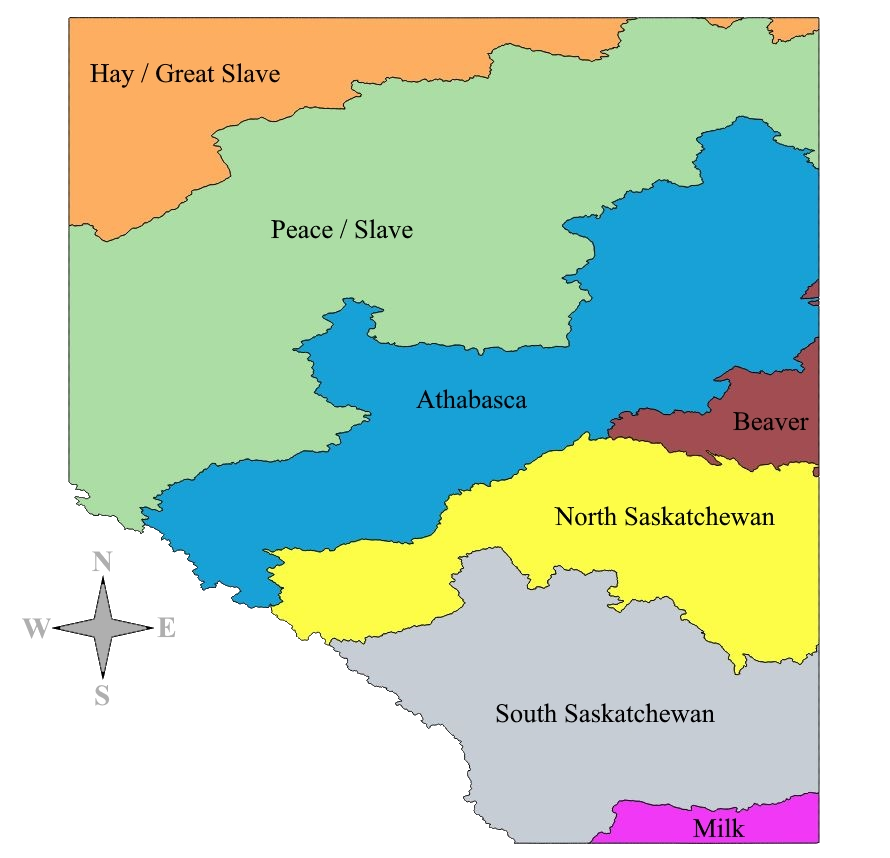
Our team members have completed a climate project for the Government of Alberta. The project involved statistical downscaling to generate high-resolution climate projections for the province of Alberta to support several Alberta Environment and Parks priority projects requiring climate change impact assessments. Then, using an integrated probability-geometric model, a set of representative climate change projections were identified for the province of Alberta to capture the full range of climate variability

Major river basins in the province of Alberta, Canada

Management zone delineation

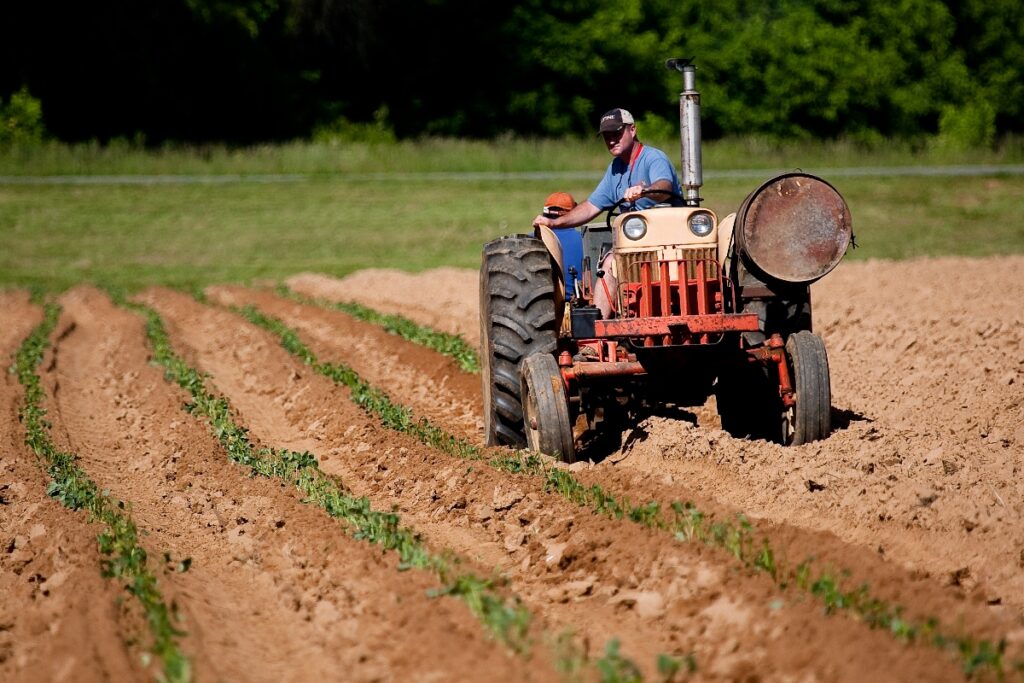
The delineation of site-specific management zones is a crucial and challenging task in precision agriculture due to many factors including climate, topography, and soil properties. It aims to divide a field into homogenous subfields where agronomists can apply optimal variable-rate fertilizers to have high-quality crops with minimum budget

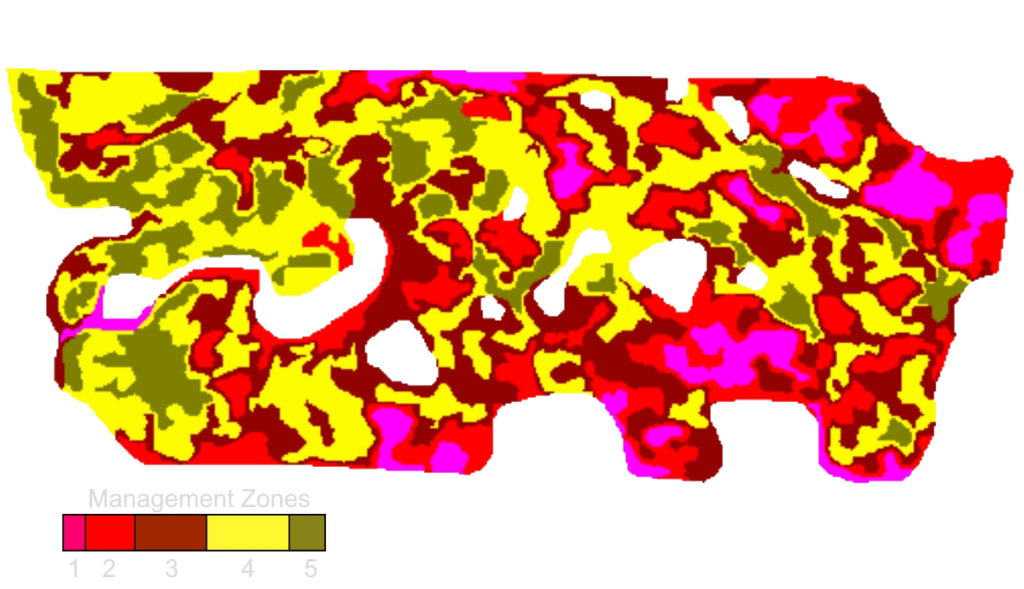
Our team has developed sophisticated classification methods that use remotely-sensed satellite imagery as well as certain elevation derived products to delineate unsupervised management zones

Some of our members have also helped FarmersEdge Inc in a project that aims to find an optimal blend of fertilizers for management zones. They have successfully delivered a fertilizer calculator software that helps agronomists to apply an optimal blend of fertilizers, such as nitrogen, phosphorus, potassium, and sulfur

A field divided into five management zones

Anti-leakage least-squares spectral analysis

Traditional spectral analysis methods, such as the Fourier method, and Lomb and Vanicek methods have shown promising results in many experiments. However, since in many practical applications measurements are not equally sampled over time, the problem of spectral leakages still remains in the spectrum, and so the signals cannot be accurately estimated. The anti-leakage least-squares spectral analysis is an improved method that accurately estimates the signals simultaneously in an iterative procedure

This method has shown much better results in many experiments. Here, we mention a few critical projects that our team has successfully completed recently using this technique

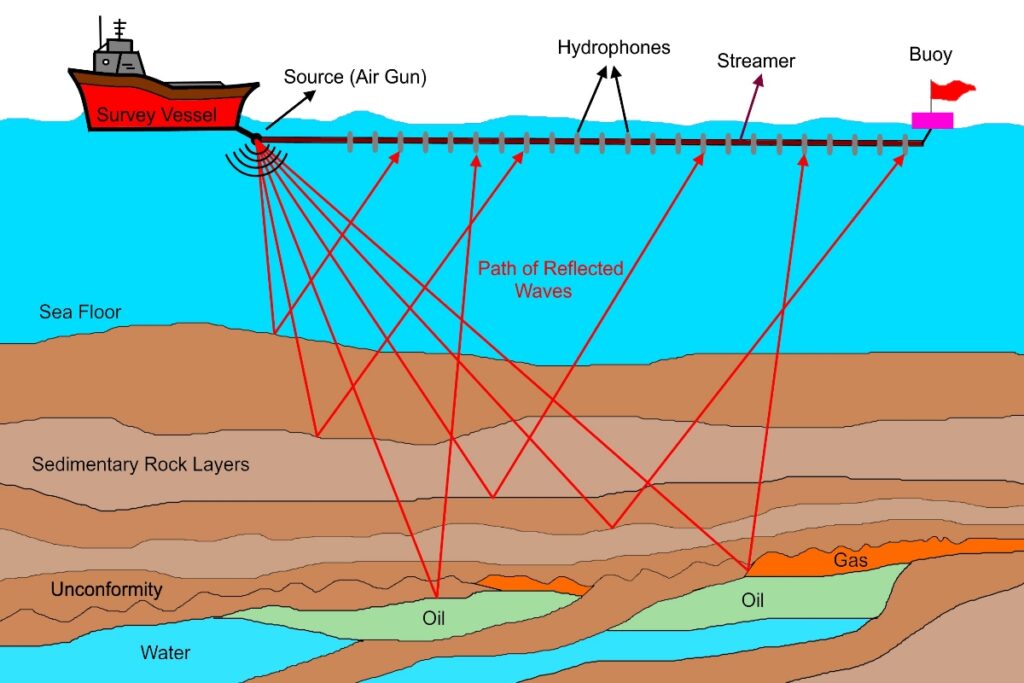
In seismology, regularly sampled seismic data are required for various purposes including wave-equation-migration, seismic inversion, amplitude versus azimuth or offset analyses, and surface-related multiple-elimination. The proposed anti-leakage spectral method can be applied to regularize seismic data rigorously

2D visualization of a marine seismic survey
Image Credit: E. Ghaderpour

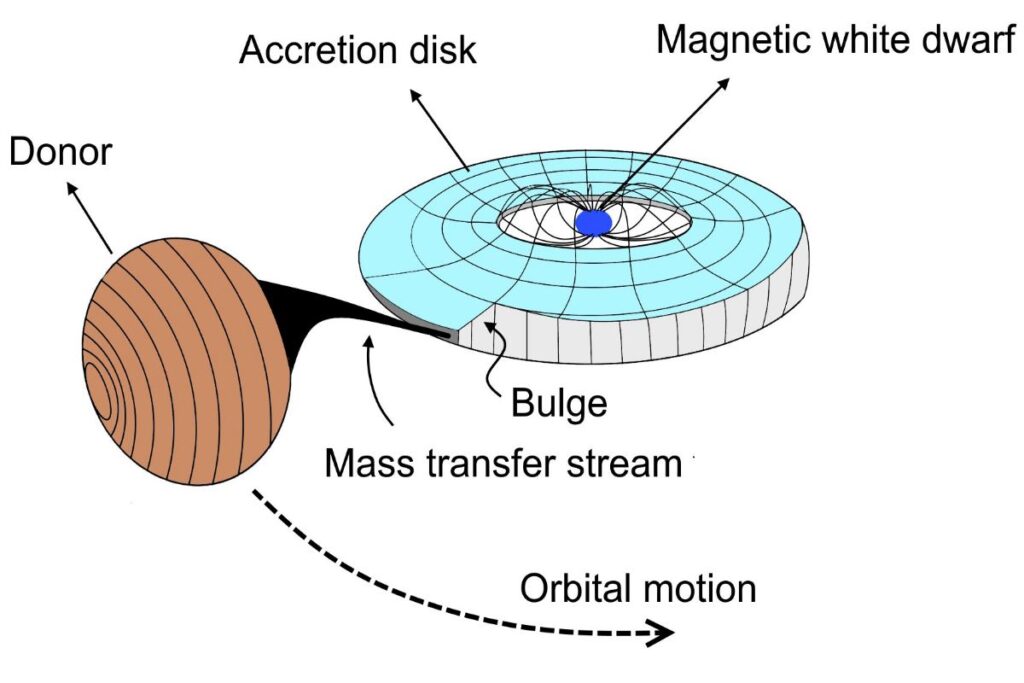
In astronomy and astrophysics, analyzing the light curves provided by telescopes can provide useful information about our universe. For instance, estimating the orbital and spin periods of star systems, as well as masses and radii of stars. The proposed anti-leakage spectral method also has shown promising results in these areas

A binary star system

Least-squares cross-wavelet analysis

Studying the possible relationships between different phenomena can help us solve many problems on our planet and in space. For example, how climate change impacts our natural resources. Precise measurements from various sources, such as satellite, airborne, and drone imagery acquired over time can help us to understand our environment better

The least-squares cross-wavelet analysis is a novel method of analyzing two series together that allows us to see the coherency and phase differences between various components of interest in the time-frequency domain. Here we mention three critical projects that our team have successfully completed using this robust method

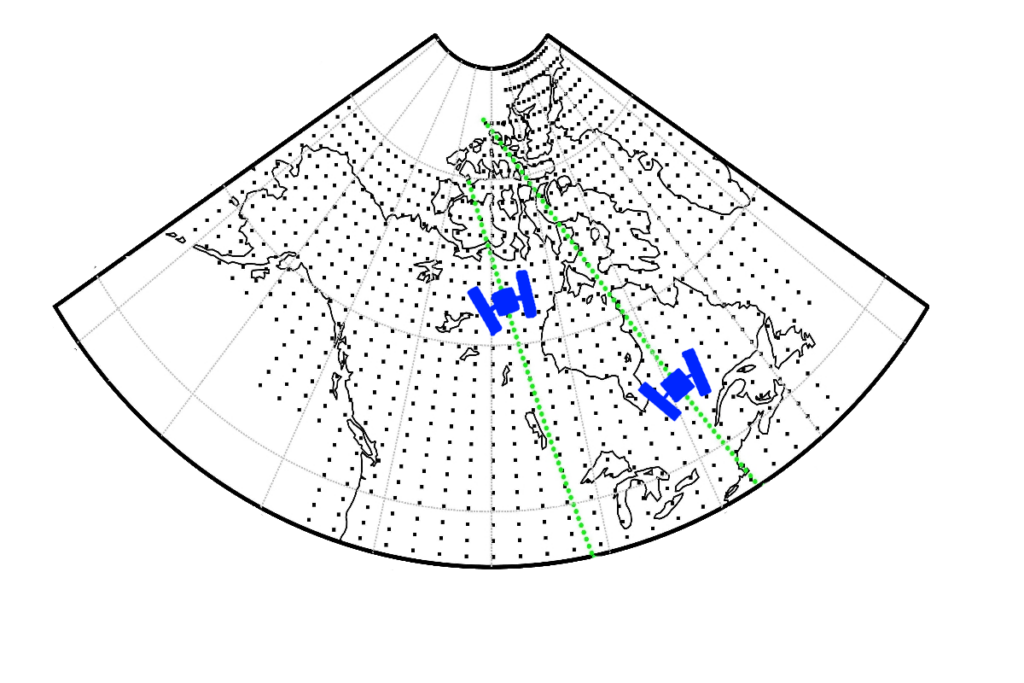
How the electromagnetic energy flux in the Earth’s thermosphere can introduce undesirable disturbances in the electrostatic gravity gradiometer measurements?

Two satellite ascending tracks over Canada

In agronomy, how precipitation and temperature variations influence the plant phenology?

Wheat

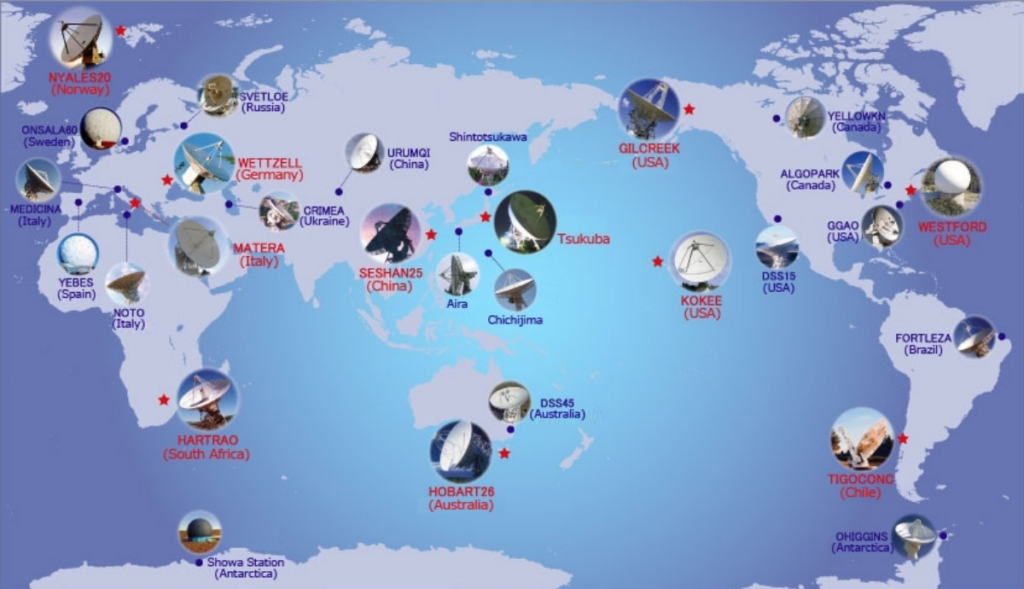
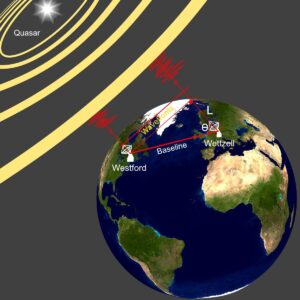
How the temperature variation is affecting the very long baseline interferometry measurements used to track the motion of Earth’s tectonic plates, Earth’s orientation, etc.?

Very long baseline interferometry main stations
Image Credit: www.sinet.ad.jp

Least-squares wavelet analysis

New advances in science and technology have made it possible to rigorously study our nature and environment. Most data sets are collections of measurements obtained over time, referred to time series. For example, a collection of satellite imagery or light curves acquired by telescopes within certain time periods, etc.

Very Long Baseline Interferometry
Image Credit: E. Ghaderpour

These time series contain many components of interests or signals which we need to find out what they are in order to understand the physics behind the phenomena. Decomposing a time series into the time-frequency domain is one powerful way that can help us to estimate what components the time series has. The least-squares wavelet analysis is a novel method proposed for this purpose. It does not necessarily require equally spaced time series, and it can consider the observational uncertainties. This method has shown promising results in analyzing various types of time series.

Multi-navigation satellite system constellation simulator

Congratulations to our team members for developing a sophisticated software package for multi-navigation satellite systems!

The software reads the ephemeris and almanac data in real-time for various constellations, such as GPS, GLONASS, and Galileo. Then it computes the satellite orbits, satellite-receiver line-of-sight, and the dilution of precisions for a single GPS receiver within a given period. It also computes the number of available satellites for every location on the Earth at a given time, extremely useful for planning purposes, and many other applications. All these functionalities are embedded in a graphical user interface that is capable of showing various animations in real-time

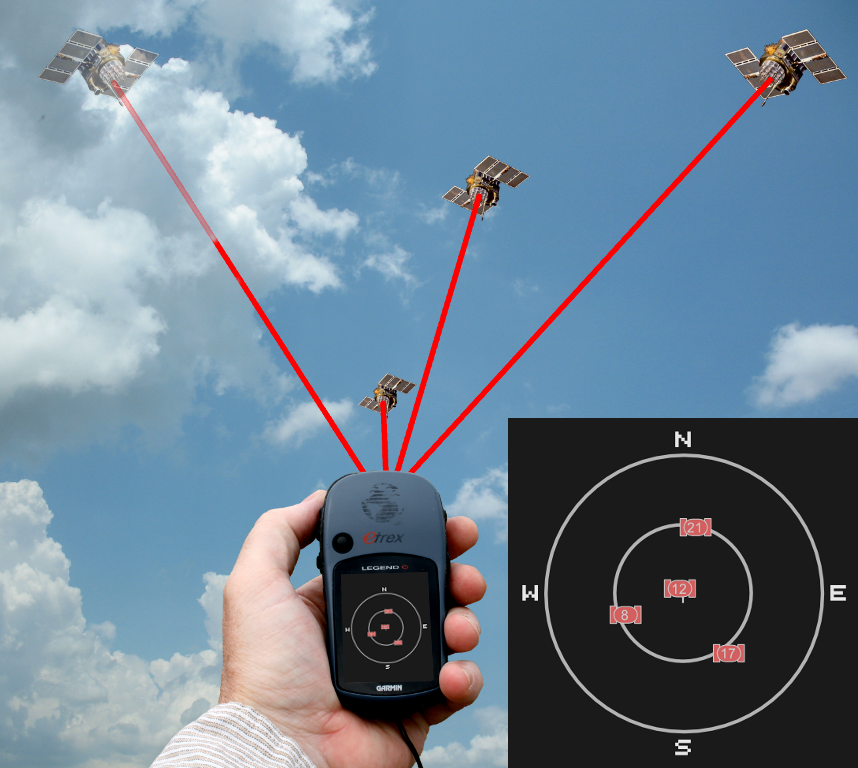
A good geometry for geometric dilution of precision
Image Credit: Wikipedia
Translate ยป